Use gdb for debugging your program
For a not so friendly os like unix, gdb is quite user friendly debugger. You can use gdb to locate bugs in your program, trace variables, find out how your recursive functions work etc.
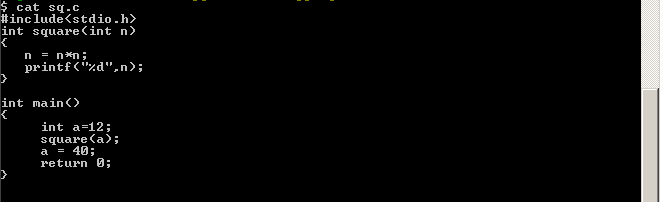
First step would be compilation of your program with -g flag. -g flag will enable gdb to used with the program
gcc -g myfile.c -o myfile
Next you run gdb on the executable program, in this case myfile.
gdb myfile
Some of the important commands to be used within gdb are
Now look at this screen shots to understand the usage

First step would be compilation of your program with -g flag. -g flag will enable gdb to used with the program
gcc -g myfile.c -o myfile
Next you run gdb on the executable program, in this case myfile.
gdb myfile
Some of the important commands to be used within gdb are
| command | Usage | Description |
| run | run run par r | execute the program till end or till first break point |
| break | break 3 break myfunction | Set a break point at the given line or function |
| step | step step 2 | Execute one statement or n statements if arg is given |
| list | list list n list function list file:function | List the source program List around the given line num List the function (of the given file) |
| print a print num+3 print/x num | Print value of expression or var with format if specified (last one prints num in hex) | |
| display | display num display a+b | Print the value of expression each time program stops |
| backtrace | backtrace bt | Prints backtrace of all the stack frames (and thus function calls) |
| frame | frame 1 frame 0 | Display content of nth frame |
| quit | quit q | Quit gdb |
| help | help help list help running help stack | Print help of a command or a category |
| continue | continue | Continue till next break point or end |
| finish | finish | Execute till the current function ends |
| clear | clear clear 8 | Clear the break point at current line or line specified |
Now look at this screen shots to understand the usage

Comments
Post a Comment